
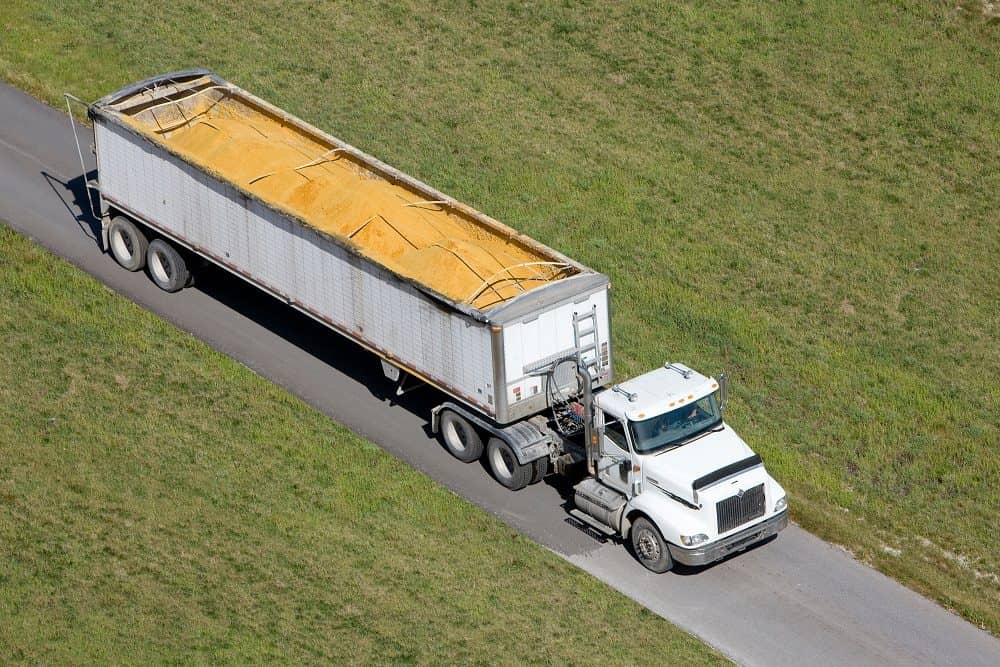
With diesel prices climbing, farmers may be leaving money on the table by delivering grain to the same buyers they have used for years. A free online calculator from the Soy Transportation Coalition (STC) offers growers a practical way to compare delivery options and determine which market could deliver the greatest return.
The calculator evaluates the financial implications of hauling soybeans, corn, wheat and other commodities to different locations, helping farmers look beyond the price per bushel to the costs of getting their grain to market.
Mike Steenhoek, executive director of the Soy Transportation Coalition, said the tool can help farmers make more informed delivery decisions as higher fuel costs reshape the economics of grain transportation.
“Farmers must not only be mindful of the price offered, but also the costs associated with transporting their soybeans, or other commodities, to market,” Steenhoek said. “In a few quick steps, the STC calculator assists farmers in measuring not only how much money will be received, but also how much will be spent.”
Farmers can access the calculator at soytransportation.org/calculator.
Calculator reveals how fuel costs change delivery decisions
The STC calculator demonstrates how a higher grain bid can lose its advantage when transportation expenses increase.
In an example provided by Steenhoek, the calculator compared two soybean delivery locations. The nearby market, 10 miles from the farm, offered $12 per bushel. A more distant market, 50 miles away, offered $12.15 per bushel.
When diesel fuel cost $3.75 per gallon in October 2025, the distant location was the more profitable option. The calculator estimated profitability per load at $10,792 for the distant market, compared with $10,767.40 for the nearby location — a $24.60 advantage for the longer haul.
But when diesel fuel increased to $6.30 per gallon in October 2026, the results reversed.
Under the same other assumptions, the nearby market generated an estimated $10,759 in profitability per load, while the distant location returned $10,750. The closer market became $9 more profitable per load despite offering a lower price per bushel.
The comparison underscores the calculator’s value: Farmers can evaluate whether a premium from a distant buyer is enough to offset the additional cost of hauling grain.
Small differences can mean thousands of dollars
The impact can multiply quickly during harvest, when farmers may transport 130, 150, 200 or more loads of grain.
In the STC’s example, the relative profitability advantage shifted by $33.60 per load between the two fuel-price scenarios. Across 150 loads, a difference of that size would equal $5,040 if the same conditions applied throughout.
Actual results will depend on each farm’s circumstances, including the prices offered, delivery distances, fuel costs and other inputs used in the calculator. The tool allows growers to assess their own scenarios rather than relying on a single market quote.
A tool for more informed farm-to-market decisions
Steenhoek emphasized that fuel is not the only consideration when choosing where to deliver grain, but it is an influential factor that farmers should revisit as costs change.
“When the cost of the journey becomes significantly higher due to diesel fuel, farmers may need to revisit whether their longstanding delivery locations for their soybeans, corn, wheat, or other commodities truly remain the most profitable decision,” he said.
The calculator works for soybeans, corn, wheat and other commodities, making it useful for a range of harvest marketing decisions.
The Soy Transportation Coalition says the tool is part of its effort to provide practical resources that help farmers improve cost-effectiveness across the agricultural supply chain.
For farmers weighing competing grain bids this fall, the calculator provides a straightforward way to compare the money coming in with the costs going out — and determine whether a familiar delivery destination is still the most profitable choice.